Log Aggregation - ElasticSearch & Kibana
In this series of posts, I run through the process of aggregating logs with Wildfly, Filebeat, ElasticSearch and Kibana.
In this post, I setup an ElasticSearch domain, which also comes with Kibana.
AWS have provided ElasticSearch and Kibana as a managed service, known as Amazon Elasticsearch Service, which takes care of the infrastructure by managing failed nodes etc, meaning a significant chunk of the complexity is taken out of it.
A relatively new feature of the Amazon Elasticsearch service is the ability to deploy it within your VPC, which changes the way you consume the service in some subtle but helpful ways. Read about that here. Essentially, the managed service is attached to your VPC via an ENI in a given subnet and you control who/what can access it via the Security Group, which means it is isolated by default.
ElasticSearch provides no authentication mechanism, so it’s up to the individual to decide how they want that implemented via a proxy etc. For the original “public” implementation, this part was often implemented as a kludgy Access Policy except for specific IPs/subnets:
{
  "Effect": "Allow",
  "Principal": {
    "AWS": "*"
  },
  "Action": "es:*",
  "Resource": "arn:aws:es:<aws-region>:<aws-account-id>:domain/<es-domain-name>/*",
  "Condition": {
    "IpAddress": {
      "aws:SourceIp": [
        "152.65.136.39/32",
        "154.79.45.21/32",
        "152.65.118.155/32"
      ]
    }
  }
}
This network level security is now (probably) more appropriately configured at the Security Group level, when creating a VPC ES Domain.
Prerequisites
As we’re effectively bolting on an external service, we need to give AWS’s Elasticsearch Service access to our VPC, to create Elastic Network Interfaces (ENIs) as required. This is as simple as running the following CLI command:
aws --region eu-west-3 iam create-service-linked-role --aws-service-name es.amazonaws.comAlternatively, this step is done as part of creating a non-VPC ElasticSearch Domain, so if you’re not the first to create an ES Domain in your AWS account then you may not need to do the above, in fact you’ll likely get something like this coming back at you:
An error occurred (InvalidInput) when calling the CreateServiceLinkedRole operation: Service role name AWSServiceRoleForAmazonElasticsearchService has been taken in this account, please try a different suffix.Creating the Domain
One could craft a snowflake ElasticSearch domain manually via the AWS Console, but then it isn’t repeatable, so that means CloudFormation beckons. The structure of the ElasticSearch resource within the template is actually quite simple, the only other resource we need to provision is an EC2 Security Group to control access to the domain.
Designing and implementing a suitable structure for a VPC can quite some time if it caters for databases, load balancers, public/private instances etc. For this exercise I’ll just use my existing VPC with a couple subnets.
Here’s my CFN template:
AWSTemplateFormatVersion: 2010-09-09
Description: "Log Aggregation ElasticSearch Domain - v1"

Parameters:
  Environment:
    Description: "Environment type"
    Type: String
    Default: dev
  ElasticSearchSubnets:
    Description: "List of 1+ subnets in which to place the ElasticSearch Domain ENI(s)"
    Default: "subnet-00c81b69,subnet-9c52a7e7"
    Type: CommaDelimitedList
  VpcId:
    Description: "VPC identifier"
    Default: "vpc-56da0b3f"
    Type: "String"

Resources:
  ElasticSearchDomain:
    Type: AWS::Elasticsearch::Domain
    DependsOn: ElasticSearchSG
    Properties:
      AccessPolicies:
        Statement:
        - Action: es:*
          Effect: Allow
          Principal: "*"
          Resource:
            !Join ["", [ !Join [":", [ "arn:aws:es", !Ref "AWS::Region", !Ref "AWS::AccountId", "domain/"]], !Join ["-", ["log-aggregation", !Ref Environment]], "/*"]]
        Version: '2012-10-17'
      DomainName:
        !Join ["-", ["log-aggregation", !Ref Environment]]
      EBSOptions:
        EBSEnabled: true
        VolumeSize: 10
        VolumeType: gp2
      ElasticsearchClusterConfig:
        DedicatedMasterEnabled: false
        InstanceCount: 1
        InstanceType: "t2.small.elasticsearch"
        ZoneAwarenessEnabled: false
      ElasticsearchVersion: 6.0
      VPCOptions:
        SecurityGroupIds:
          - !Ref ElasticSearchSG
        SubnetIds:
          - !Select [0, !Ref ElasticSearchSubnets]

  ElasticSearchSG:
    Type: AWS::EC2::SecurityGroup
    Properties:
      GroupDescription: Access to AWS ES domain from our app subnet
      GroupName:
        !Join ["-", ["log-aggregation", !Ref Environment]]
      SecurityGroupIngress:
      - FromPort: 443
        IpProtocol: tcp
        ToPort: 443
        CidrIp: "10.10.0.0/21"
      VpcId: !Ref VpcId

Outputs:
  ElasticSearchDomainEndpoint:
    Description: "Endpoint URL for ElasticSearch"
    Value: !GetAtt ElasticSearchDomain.DomainEndpoint
    Export:
      Name: "ElasticSearch-Endpoint-URL"
  ElasticSearchKibanaEndpoint:
    Description: "Endpoint URL for Kibana"
    Value: !Join ["", ["https://", !GetAtt ElasticSearchDomain.DomainEndpoint, "/_plugin/kibana/"]]
    Export:
      Name: "Kibana-URL"
I defaulted my parameters to my dev environment’s values, which makes it real simple for updating/re-creating a template.
Note that I added a couple Outputs at the end there, this is so we can programmatically extract both the ElasticSearch endpoint to send logs to and the Kibana URL to analyse the logs. Both these values are also accessible on the Elasticsearch Service screen.
Here’s what we can now see in the Elasticsearch Service Dashboard:
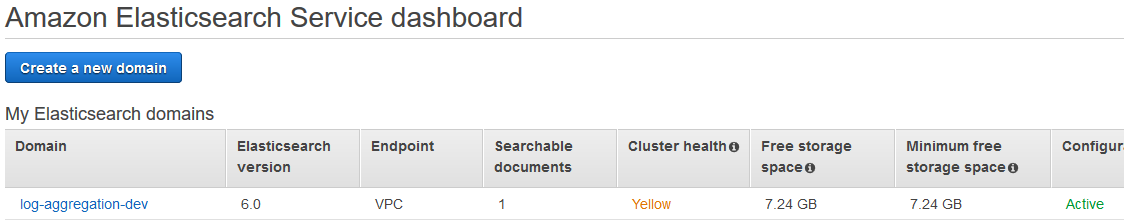
You will notice that the Cluster Health of the domain is Yellow, this is because I only configured one node/instance and so it has no way to store my data redundantly, obviously not a good scenario for a production environment.
Drilling down into the domain:
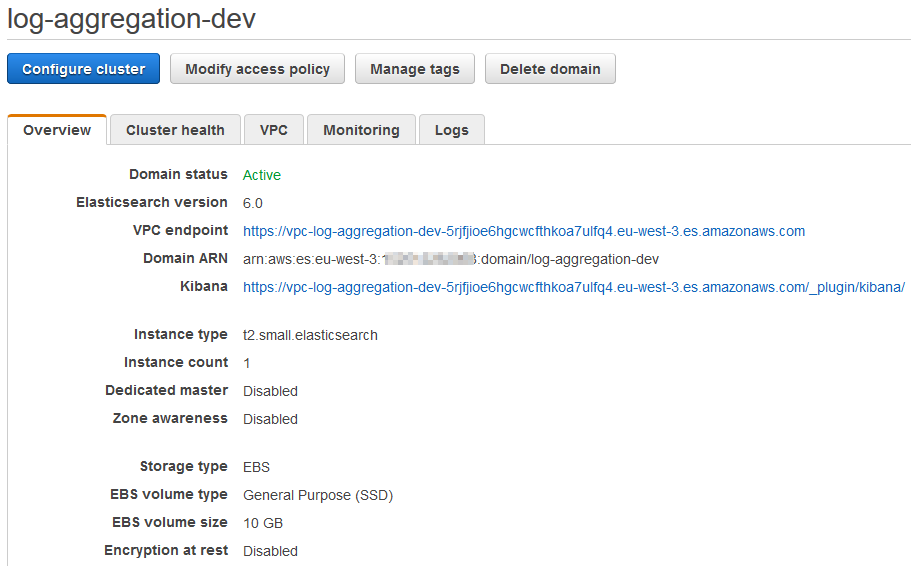
Now, clicking through to your Kibana link will NOT work from your local PC, this is because the ES Domain is within our VPC and is not public. You can create an SSH Tunnel to either an existing instance or a new instance within the subnet(s) blessed with access.
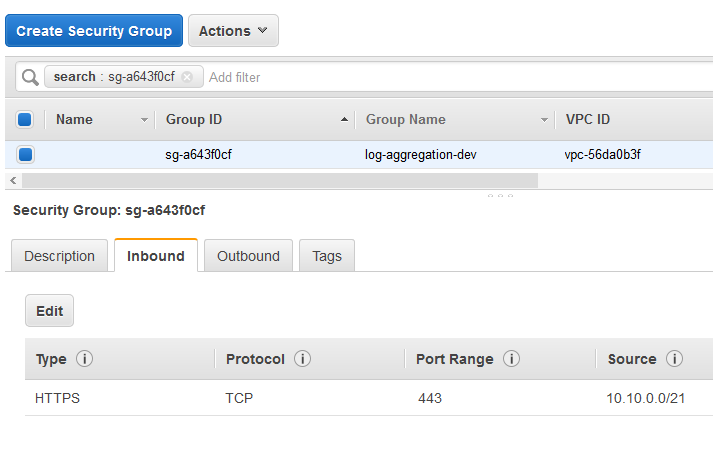
Here’s what the Security Group looks like from our template above:
This is a simple example of the ElasticSearch Domain, there are plenty of other options you may want to implement, such as Encryption at Rest, snapshots, CloudWatch monitoring/alerting of cluster metrics and authentication via a proxy.
Pricing
This domain, as configured by the above template with the single t2.small.elasticsearch instance type will cost about in the order of 0.038c/hr in Paris or about $US28/mth (I somehow randomly chose the most expensive!). As always, the pricing varies per AWS region, I note that the price of the same instance type in many other regions is actually 0.018c/hr, less than half the cost!
Importantly, unlike EC2 instances, you cannot shutdown your instances overnight or weekend to lower costs, you could potentially drop the number of nodes from say 4 down to 3 but probably not worth the hassle.
For now, that builds out our ElasticSearch Domain as a key plank in our Log Aggregation architecture, further posts in this series will fill in the gaps.