Log Aggregation - Filebeat
In this series of posts, I run through the process of aggregating logs with Wildfly, Filebeat, ElasticSearch and Kibana.
In this post, I install and configure Filebeat on the simple Wildfly/EC2 instance from Log Aggregation - Wildfly.
Now that we’ve got our really simple application up and running producing some log output, it’s time to get those logs over to the ElasticSearch domain.

For the purpose of shipping logs from instances to ElasticSearch I’ve been involved with a project where we’re using Logstash to do this task. It certainly gets the job done but can be rather heavy on memory, likely having to do with it’s heritage of being written in Ruby and run on Java, something of a double whammy of memory consumption.
Most often I see Logstash consuming around 400MB of memory on our instances, which isn’t terrible on an instance with 2GB+ of memory, but it is meant to be a supporting app to the main purpose of running the instance, a service or application on Wildfly, which itself is typicaly given 1024MB.
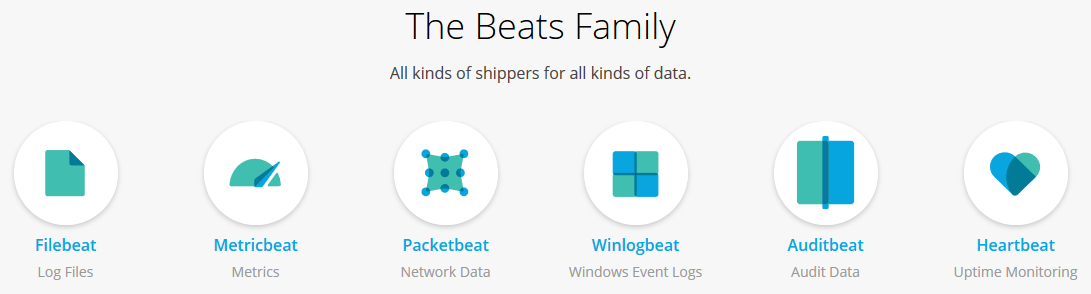
The is where a relatively new project in Filebeat is seemingly the logical alternative - with at least an order of magnitude less memory required! I’ve seen it humming along nicely using a mere 23MB. I’m sure Filebeat doesn’t completely replace some uses of Logstash, but for shipping vanilla logs it seems to be spot on. It is one of a family of several new data collectors, known as The Beats Family.
Typically, with the ELK stack, logs are parsed and filtered by Logstash prior to sending just the useful logs to ElasticSearch. Filebeat works differently in that it sends everything it collects, but by utilising a new-ish feature of ElasticSearch, Ingest Nodes, we can achieve the same outcome.
An Ingest Pipeline declares a series of steps to transform the incoming logs to a format desirable for consumption; such as extracting Service Names, IP addresses or Correlation IDs into separate fields.
Install & Configure Filebeat
First up, download and install the binary package from elastic.co:
 curl -L -O https://artifacts.elastic.co/downloads/beats/filebeat/filebeat-6.0.1-x86_64.rpm
 rpm -vi filebeat-6.0.1-x86_64.rpm
You’ll then find the relevant configuration files in the /etc/filebeat/ directory.
The main configuration file is /etc/filebeat/filebeat.yml, which out of the box comes with a pretty helpful configuration. There’s also another file in the directory filebeat.reference.yml which provides example configuration of essentially every possible option.
There are three sections in my somewhat minimalist configuration for the environment we’ve been building up over the last couple posts.
Prospectors
The Prospectors are the name given to the components that keep track of the different log files you want to follow, in our case, the /var/log/server.log Wildfly log file. Here we also set a couple fields which will help us filter down our logs when we get over to Kibana, combined with the fields extracted by the Ingest Pipeline, this is core to making the most of the entire log aggregation process.
#============================== Prospectors =====================================

filebeat.prospectors:
- type: log
  enabled: true
  paths:
    - /var/log/server.log
  fields:
    component_name: example_app
    environment: dev
  fields_under_root: true
Outputs
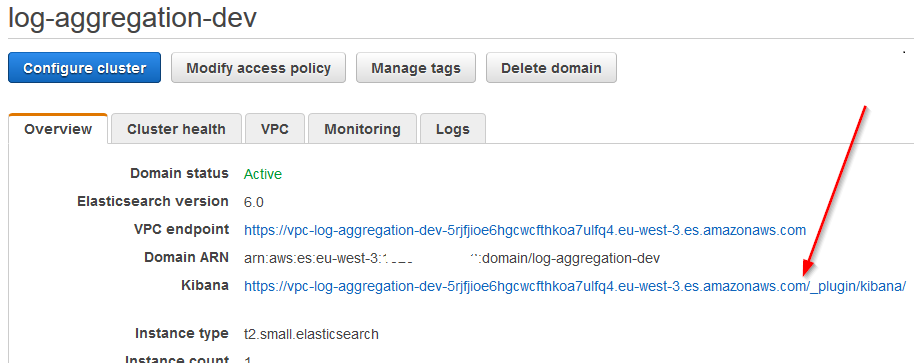
Next up are the Outputs, which simply tells Filebeat where to send out log lines, in our case ElasticSearch, from our Amazon Elasticsearch Domain we get the VPC Endpoint to put in there (i.e. https://vpc-log-aggregation-dev-5rjfjioe6hgcwcfthkoa7ulfq4.eu-west-3.es.amazonaws.com/).
Important here are also the index into to which we’ll lob our logs, and also the Ingest pipeline that will parse our data (for now pick a name and we’ll create the pipeline later).
#============================== Outputs =====================================

output.elasticsearch:
  enabled: true
  hosts: ["<ELASTICSEARCH_DOMAIN_ENDPOINT>:443"]
  protocol: "https"
  index: "example-%{+yyyy.MM.dd}"
  pipeline: "example-pipeline-dev"
  ssl.enabled: true
  ssl.supported_protocols: [TLSv1.2]
  ssl.cipher_suites: [ECDHE-RSA-AES-128-GCM-SHA256,ECDHE-ECDSA-AES-128-GCM-SHA256,ECDHE-RSA-AES-256-GCM-SHA384,ECDHE-ECDSA-AES-256-GCM-SHA384]
  ssl.curve_types: [P-256,P-384]
Template
The last section is the Template, which guides our object structure that ends up in ElasticSearch. Retaining the naming patterns the same style of example- keeps thing simple.
#============================== Template =====================================

setup.template.enabled: true
setup.template.name: "example-%{+yyyy.MM.dd}"
setup.template.pattern: "example-*"
setup.template.fields: "${path.config}/fields.yml"
setup.template.overwrite: true
setup.template.settings:
  index:
    number_of_shards: 2
In theory we could start the Filebeat service now but it will only end up throwing errors as the ingest pipeline doesn’t exist yet, which brings us to the next step.
Ingest Pipeline
Now that we’ve got Filebeat ready, we need to refer back to our ElasticSearch domain from part 1 to configure an Ingest Pipeline.
The default log pattern configured in Wildfly is something like this:
<pattern-formatter pattern="%d{yyyy-MM-dd HH:mm:ss,SSS} %-5p [%t] %c %s%E%n"/>Which formats the log lines like this:
2018-02-18 14:05:30,768 DEBUG [default task-2] com.thecuriousdev.logaggregation.healthcheck.HealthCheckServlet Hit /healthcheckSo this is the pattern we’ll be parsing to extract out a couple properties that we might want to filter our logs on; such as the class, thread and severity.
An Ingest Pipeline allows one to apply a number of processors to the incoming log lines, one of which is a grok processor, similar to what is provided with Logstash.
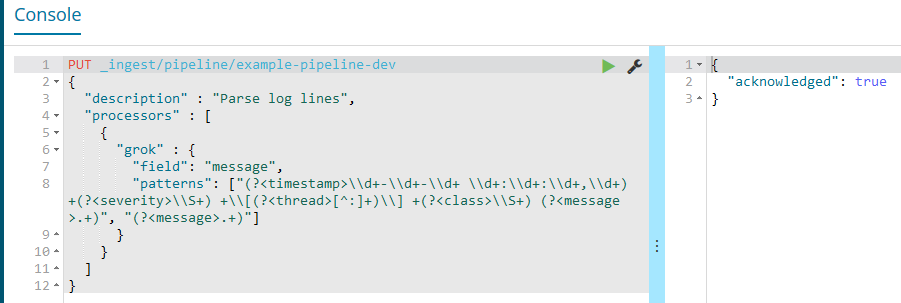
Extracting fields from the incoming log data with grok simply involves applying some regex 1 logic. The following pipeline structure will extract fields from the above line and put them into the named (i.e. <timestamp>) fields:
{
  "description" : "Parse log lines",
  "processors" : [
    {
      "grok" : {
        "field": "message",
        "patterns": ["(?<timestamp>\\d+-\\d+-\\d+ \\d+:\\d+:\\d+,\\d+) +(?<severity>\\S+) +\\[(?<thread>[^:]+)\\] +(?<class>\\S+) (?<message>.+)", "(?<message>.+)"]
      }
    }
  ]
}
So from the log line shown above we should get these fields populated:
timestamp=2018-02-18 14:05:30,768
severity=DEBUG
thread=default task-2
class=com.thecuriousdev.logaggregation.healthcheck.HealthCheckServlet
message=Hit /healthcheck
You might have noticed that I put a much simpler “catch-all” pattern in there too, which simply puts everything in the log line into the message field. That patterns array appears to work on a “fall through” process where if the log line doesn’t match a pattern, the next one is tried, at least that’s what it seems to be doing.
Add Ingest Pipeline to ElasticSearch
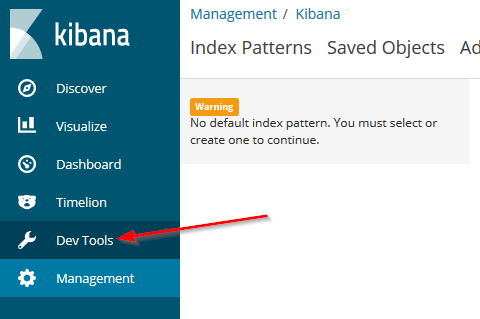
Using the URL from the ElasticSearch domain, Open Kibana (you’ll likely need an SSH Tunnel to get to it):
Then choose the “Dev Tools” section:
And then execute a PUT for our new pipeline:
This is the manual way to configure the pipeline, ideally it would be scripted as part of our domain creation.
Now, briefly flipping back to our instance, start the filebeat service:
service filebeat start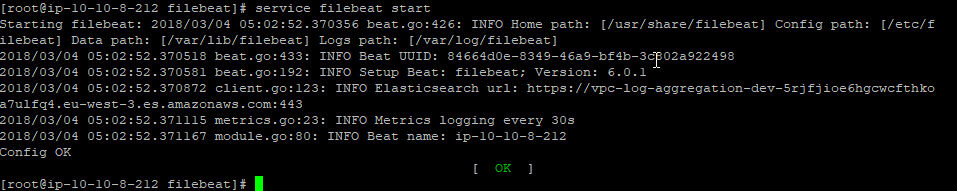
Have a look in kibana
So with the Filebeat service now running (Wildfly was already running but I restarted that too for more logs), we should be able to see our logs appear very quickly within Kibana. Having hit the simple URL we built in Log Aggregation - Wildfly a few times, that will produce the expected logs:
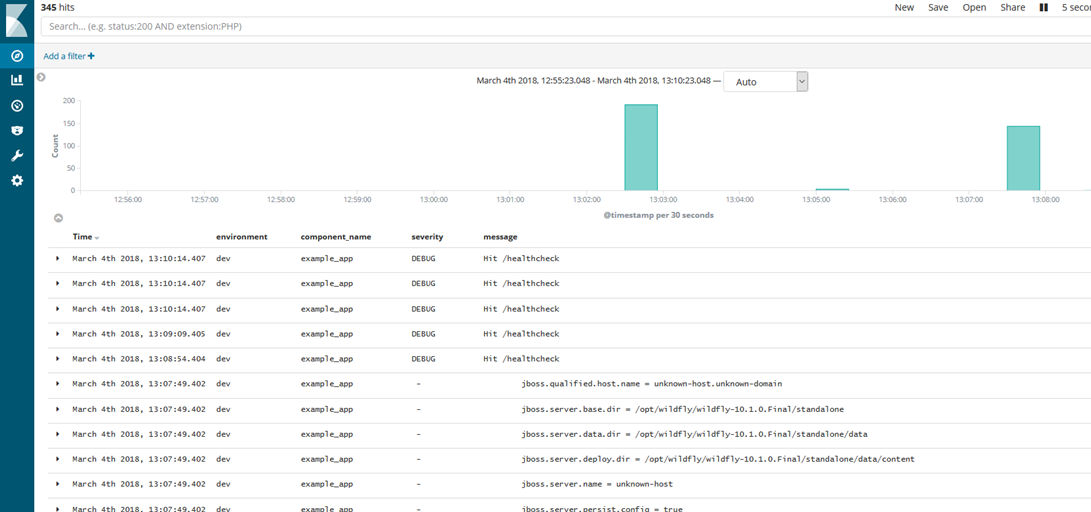
Delving in a bit deeper we can look at the fields that Kibana has presented (from ElasticSearch) for just one item:
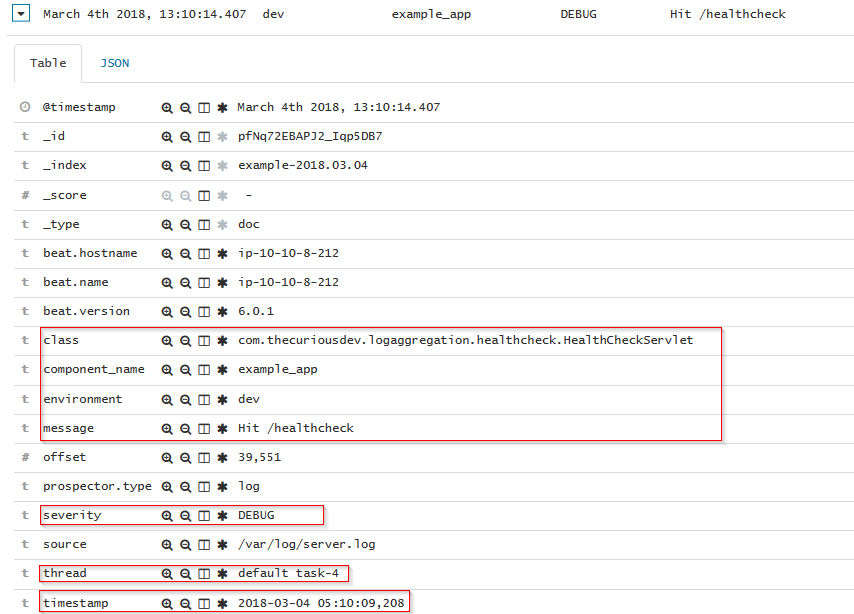
I’ve highlighted a few fields that were specific to our configuration & ingest pipeline, here’s the original log line within Wildfly’s /var/log/server.log:

We can now use the power of ElasticSearch via the Kibana interface and filter the logs for a particular field or fields, obviously in a more useful setting we’d likely have many instances shipping logs to our ElasticSearch Domain. In that scenario it’d likely require an upsizing of the instances or number of instances, but that is best left for another post.
Summary
So that’s the end-to-end for our Log Aggregation workflow: Wildfly → Filebeat → ElasticSearch → Kibana.
There’s still a ton of other features I’m yet to explore with any and all of these components.
Undeniably, this stack is an invaluable asset to most projects. I think it is sensible to have this in place before a line of code has barely been written for a project, that way it will save many a developer SSHing into a growing number of servers (assuming microservices architecture) to work out what is happening for a particular scenario.
Links
- Amazon Elasticsearch Service
- Amazon Elasticsearch Service - Developer Guide
- Wildfly
- Filebeat
- ElasticSearch
- Kibana
- As the joke goes: You have a problem, you want to solve it with regex, then you’ve got two problems :) [return]